Finding a Dead Zone
in a Drying Chamber
The Brief
A manufacturer drying a sheet product in a forced-air chamber was seeing slow, uneven cure. The edges of the sheet were ready on schedule but the centre lagged behind and set the cycle time. Before spending money on changes, they needed to know why.
The Approach
Rather than guess at fan speeds or duct changes, we built a CFD model of the chamber, the sheet and the air supply, and plotted air velocity through the airspace and across the sheet surface.
What the Model Showed
Air over the centre of the sheet is close to stagnant (under 0.4 m/s), while the edges see around 1.5 to 3 m/s. Low airflow means slow moisture removal, which matches the late cure in the middle of the sheet. The still zone also extends up into the air above the sheet, so the cause is the overall airflow pattern in the chamber, not just conditions at the surface.
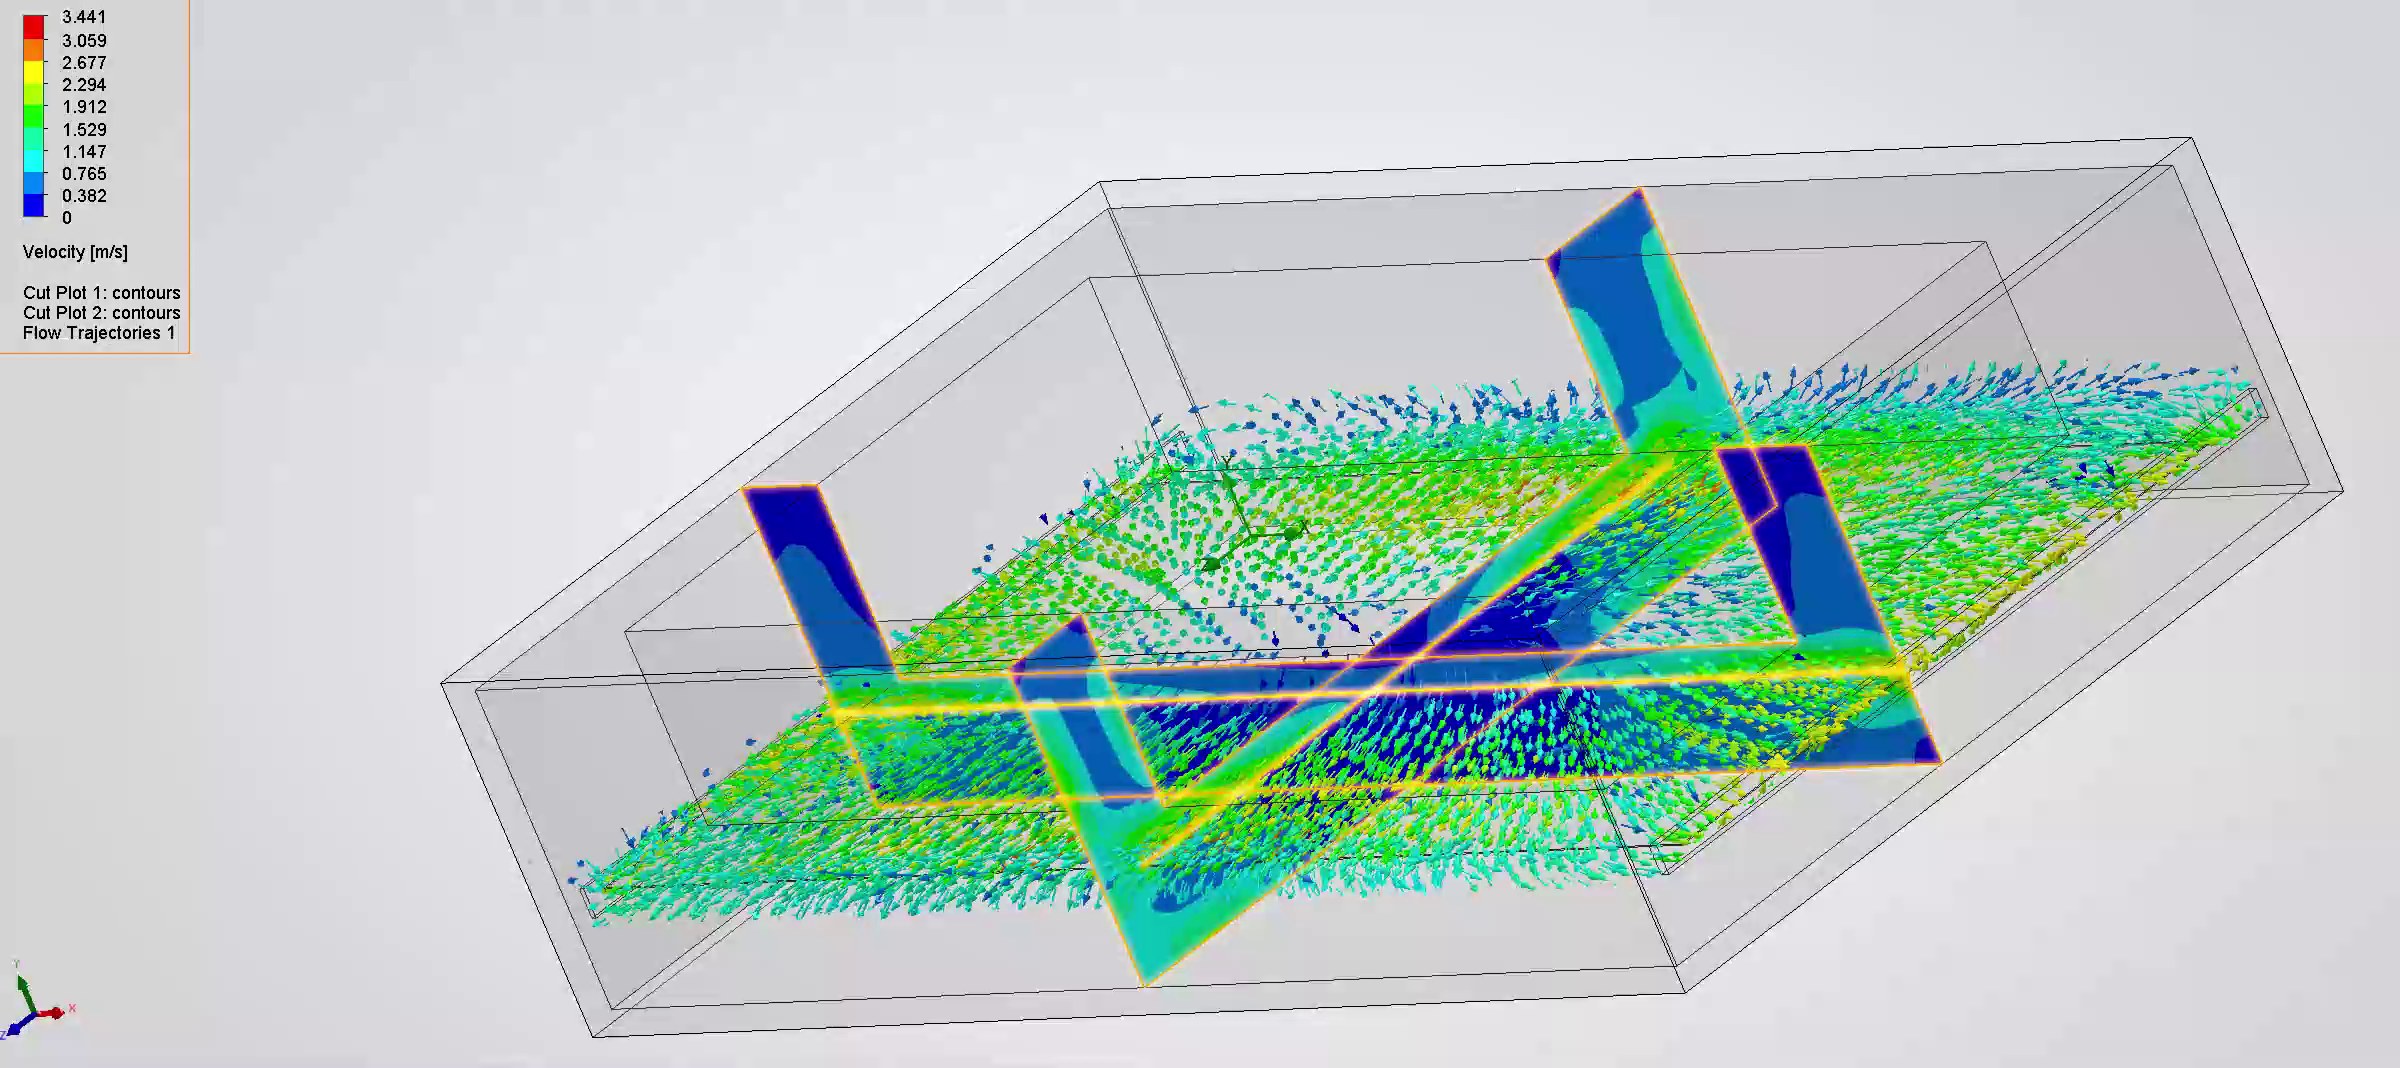
Velocity contours and flow vectors through the chamber. Dark blue marks near-still air over the centre of the sheet.
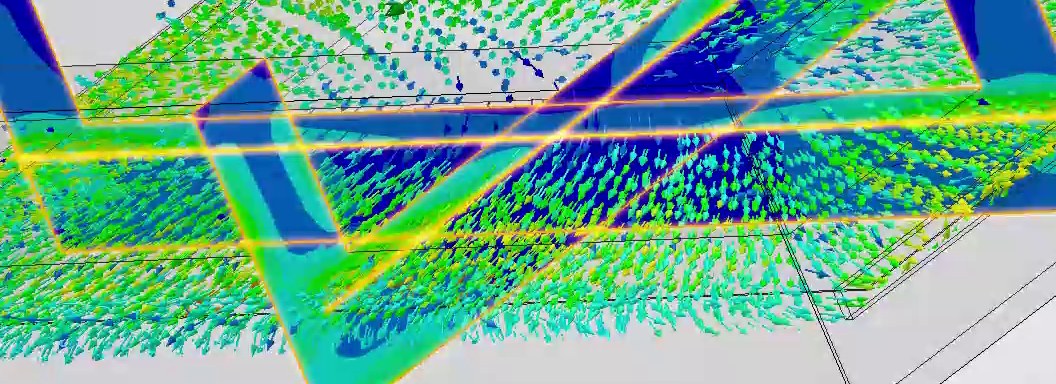
Close-up of the stagnation zone over the centre of the sheet.
Outcome
Knowing where the air is and is not going is what lets any change to baffles, inlets or fans be aimed at the real problem, rather than trial and error on a live line.
Got a similar problem? Call for a free initial consultation.
07549 032776